For ACoP 2024 - Go to here.
Dear Colleagues,
On behalf of the Planning Committee, I cordially invite you to attend the Fourteenth American Conference on Pharmacometrics (ACoP14) to be hosted from November 5-8, 2023 at the Gaylord National Resort and Convention Center in National Harbor, Maryland, USA.
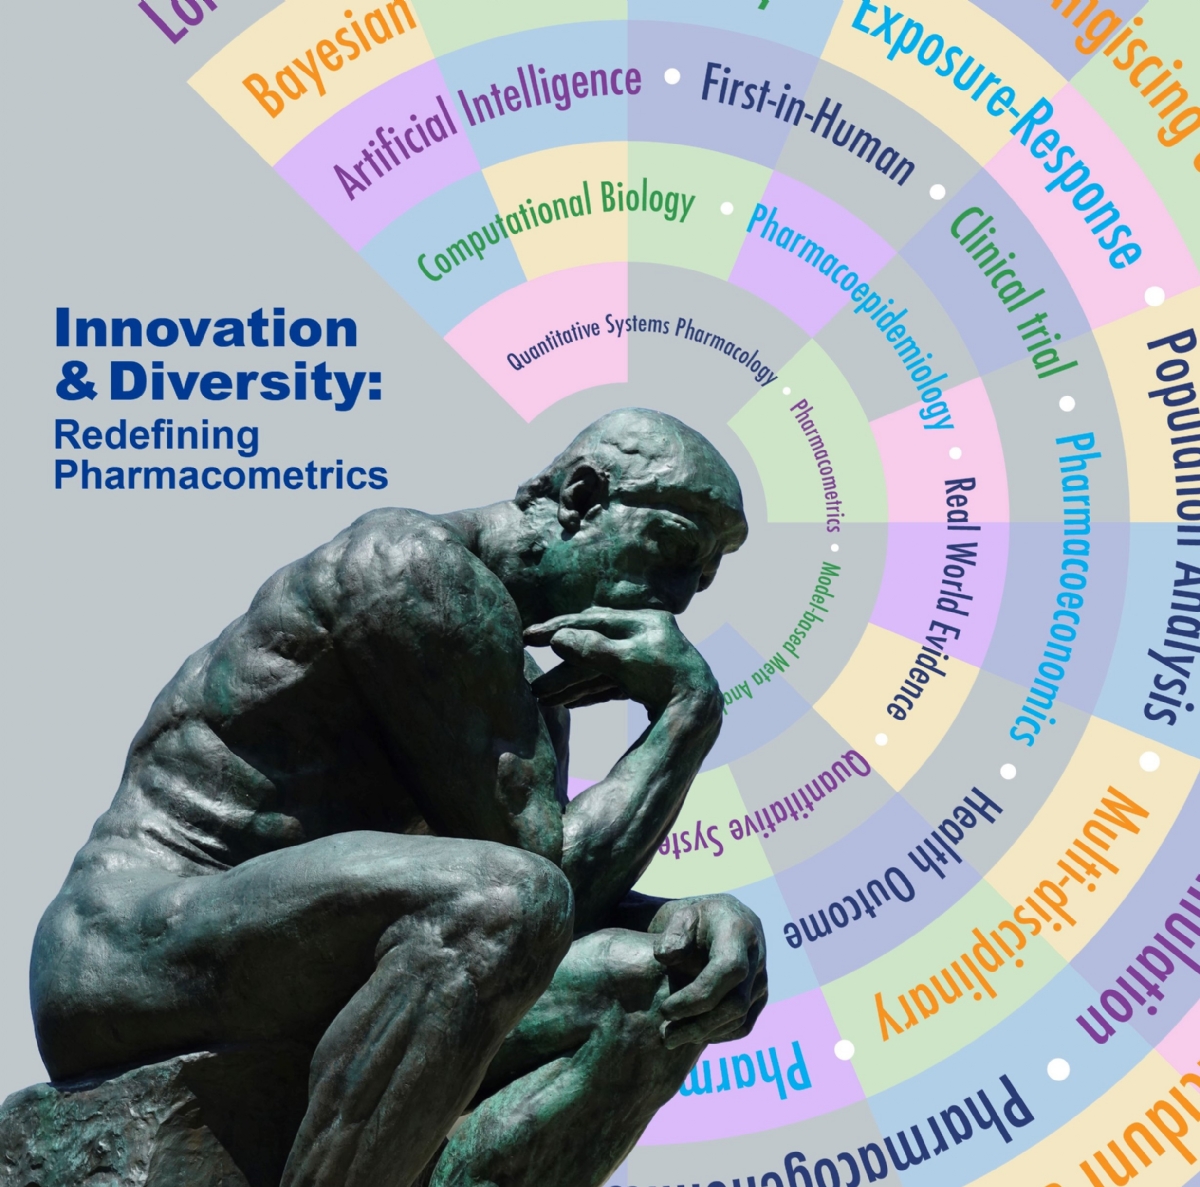
The theme of ACoP14 is “Innovation & Diversity: Redefining Pharmacometrics”. This theme was inspired by the extraordinary advancement made in the field of Pharmacometrics (PMX), the diverse and successful applications of PMX in countless therapeutic areas, and its multidisciplinary approaches to support drug discovery and development that yield shared decision making between individuals with different expertise. Our theme aligns with ISoP’s vision to promote and advance the discipline of PMX and broaden its impact. It also embraces the pillars of our 5-year strategic plan: Scientific Expertise and Innovation, Influence, Education, Tools and Resources, and Internationalization.
Here are a few updates from the ACoP14 Planning Committee:
- Scientific Program: Take a sneak peak below!
- Scientific Abstracts: We are thrilled to bring to you 350+ posters at ACoP14. Notifications on scheduling for all abstracts are on their way. Also, CONGRATULATIONS to our 10 Abstract Awards Winners. What a great achievement! We look forward to attending your presentations at ACoP14 and learning more about your work.
- Workshops: Many pre- and post-conference workshops dedicated to pharmacometrics and related disciplines are available for you to attend. Do not wait, Register today!
- Diversity, Equity, and Inclusion (DE&I): We are looking forward to welcoming the inaugural class of the Pharmacometrics Excellence and Diversity Fellowship at ACoP14. This program’s awardees will receive several benefits including full ISoP membership, complete access to ACoP14 events, conference travel and lodging, dedicated networking and scientific events designed to familiarize them with the field of PMX and broaden their career prospects beyond their current fields of expertise. We have received tremendous interest from trainees in quantitative or pharmaceutical disciplines across several institutions. Thank you to all applicants!
- Trainee Community Events: We are planning many exciting events for our trainees. 1) Speed Mentoring Event for Trainees to talk with professionals from all different walks of life, disciplines, and experiences (Plus, lunch never hurts)! 2) Workshop for Trainees titled “Transitioning from Us to Them: A Soft Skills Workshop for Successfully Navigating Diverse Teams,” 3) ISoPx Trainee Talks: come see the panel of trainees talk about various topics, with some prizes and fun built in!
- Social Event: We are excited to announce the theme of “International Masquerade” for ACoP14’s main social event this year! Please feel free to wear a mask that represents your heritage, identity, etc., or design your own mask with the DIY mask-making supplies that will be supplied at the event. We’ll be playing international music on the dance floor and celebrating our diverse ACoP population and innovative mask ideas! Some additional highlights this year include an interactive scavenger hunt and a happy hour during one of the poster sessions. If you registered for the Buddy System, prepare to make a new connection, and expand your network!
- Universities Alumni Receptions: We are delighted that six universities will have their alumni receptions at the ACoP14. Whether you graduated recently or many moons ago, this event is YOUR chance to reconnect with your old friends and professors. Come, enjoy some delicious food and beverages, explore exciting updates from your alma mater, and share your stories and experiences. See you there, Alumni!
- ISoP Awards: Stay tuned for the official announcement of the 2023 ISoP Awardees. Together, we will celebrate and honor these exceptional individuals who have advanced the frontiers of knowledge and innovation. Join us in applauding their remarkable achievements during the ACoP14.
We will post regular updates on this webpage to keep you informed. Stop back periodically!
I look forward to seeing you at ACoP14.
Sincerely,
Sihem Bihorel, MSc, PharmD, PhD
ACoP14 Conference Chair
“Rien ne se perd, rien ne se crée, tout se transforme”. “Nothing is lost, nothing is created, everything transforms”.Antoine Lavoisier (1743-1794). Father of Modern Chemistry.Lavoisier coined the Law of Mass Balance (or Law of Conservation of Mass), a basic tenet of Pharmacometrics.